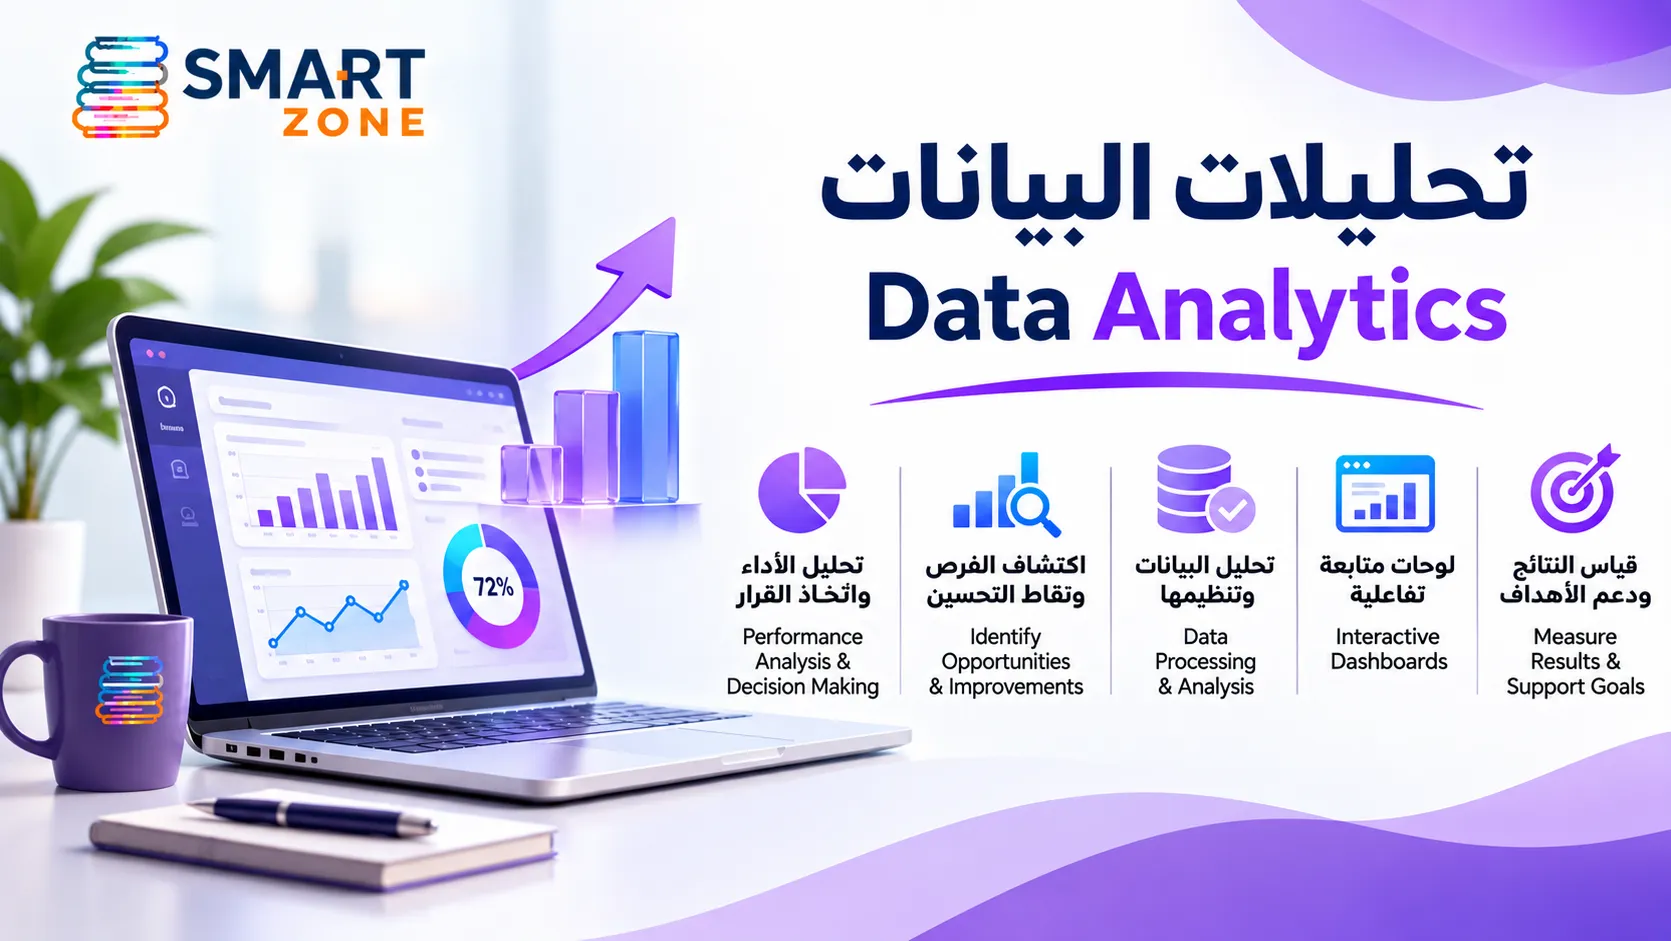
At Smart Zone, we provide data analytics services in Jordan to help businesses organize information, understand performance, identify improvement opportunities, and make informed decisions using meaningful data.
Businesses generate information through websites, ecommerce stores, internal management systems, marketing campaigns, and customer interactions.
However, collecting information is only the beginning. To create business value, data must be organized, validated, analyzed, and presented in ways that support practical decisions.
Our data analytics approach combines business requirements analysis, data integration, performance measurement, visualization, and reporting.
We help businesses develop analytics solutions that reflect their actual operations, available data sources, and strategic priorities.
We begin by understanding business goals, reporting needs, and the questions decision-makers want to answer.
This helps define relevant metrics and data sources.
We help gather information from authorized sources such as websites, ecommerce platforms, business applications, and databases.
Collection methods depend on system capabilities and access permissions.
We review datasets for missing values, duplicates, formatting inconsistencies, and other quality issues.
Reliable reporting requires well-prepared information.
We help connect appropriate data sources through databases, APIs, and supported integrations.
This can reduce manual reporting and improve information consistency.
We identify KPIs relevant to business objectives, such as inquiries, orders, revenue, conversions, and operational activity.
Each metric should have a clear definition and calculation method.
We create dashboards that present important indicators through understandable visual interfaces.
Dashboards can be organized by department, project, business unit, or reporting period.
We analyze available website traffic, engagement, content performance, and acquisition information.
These insights help businesses understand how visitors interact with their websites.
We help review GA4 events and reporting configurations.
Depending on implementation, events may include contact submissions, WhatsApp interactions, product activity, and purchases.
We review organic search impressions, clicks, queries, and page performance.
This supports decisions about SEO priorities and content optimization.
We compare campaign metrics using available advertising and analytics data.
Relevant indicators may include cost, engagement, conversions, and campaign outcomes.
We examine available interaction data to understand customer journeys and potential obstacles.
Privacy, consent, and appropriate data access are important considerations.
We review the relationship between visits and meaningful actions, including inquiries, registrations, and purchases.
This can help identify opportunities to improve conversion journeys.
We analyze available order, product, category, and revenue data.
Findings can support merchandising, marketing, and operational decisions.
We compare product demand, engagement, and relevant commercial metrics.
This helps businesses understand differences across their product catalog.
We organize sales information by relevant dimensions such as time, product, and channel.
Reports can support target tracking and commercial planning.
When suitable CRM data is available, we analyze lead stages, inquiry sources, and recorded sales outcomes.
This helps teams review their customer acquisition process.
We examine information related to tasks, orders, services, and internal processes.
The objective is to identify measurable opportunities for operational improvement.
We can develop reports covering available revenue, expense, and period comparison data.
These analyses depend on the quality of source records and do not replace professional accounting or financial audits.
We compare indicators across daily, weekly, monthly, or annual periods.
This can help reveal seasonal patterns and longer-term changes.
We divide information into meaningful groups such as acquisition channels, product categories, or geographic regions.
Segmentation can reveal patterns hidden within overall averages.
We examine the stages users complete before reaching a defined conversion.
This helps identify steps where users frequently leave the process.
When suitable data is available, we review repeat purchases, ongoing engagement, or customer activity over time.
This supports a better understanding of retention patterns.
We summarize historical performance to explain what happened and how results changed.
Outputs may include charts, tables, and key indicators.
We investigate possible explanations for performance changes and relationships between variables.
We distinguish correlation from causation and avoid presenting unsupported conclusions.
When data quality and volume permit, we can explore forecasting models to estimate potential future patterns.
Predictions depend on assumptions and should not be treated as guaranteed outcomes.
We help reduce repetitive manual reporting through suitable data connections and scheduled updates.
Automation depends on available integrations and project requirements.
We prepare reports that highlight important KPIs, changes, and areas requiring attention.
Information is organized to support practical decision-making.
We use charts, comparisons, and interactive displays to communicate complex information clearly.
Visualizations are selected according to the nature of the data.
We consider access permissions, sensitive information, and responsible data handling.
Analytics implementations should follow applicable legal and contractual requirements.
We review metric definitions, source consistency, and changes that may affect reporting accuracy.
This helps maintain confidence in analytical outputs over time.
Data analytics is the process of collecting, organizing, examining, and interpreting information to identify useful patterns and support decision-making.
It can involve marketing, operational, customer, ecommerce, and financial data.
Data analysis helps businesses move beyond assumptions by providing measurable indicators of performance.
It can also reveal inefficiencies, customer behavior patterns, and areas for improvement.
Data analytics focuses on exploring information and extracting insights.
Business intelligence commonly emphasizes reporting, dashboards, and ongoing KPI monitoring.
The two disciplines often overlap and complement one another.
Website and ecommerce analytics can help businesses understand traffic sources, customer interactions, product activity, and conversion journeys.
Reliable insights require properly configured measurement systems.
Custom Laravel applications can support tailored reporting dashboards, database queries, and integrations with relevant information sources.
Implementation depends on system architecture, security requirements, and performance considerations.
Historical data can support forecasts in suitable circumstances, but predictions are subject to uncertainty.
Accuracy depends on data quality, assumptions, and changing business conditions.
We begin by defining business questions, data sources, and relevant KPIs.
Next, we prepare the information and develop agreed analyses, dashboards, and reports.
We validate outputs and review opportunities for further improvement.
Smart Zone combines software development, database management, system integration, and digital analytics capabilities.
This allows us to create analytics solutions connected to the systems businesses actually use.
Our focus is on reliable data, useful reporting, and practical business insights.
Looking for data analytics services in Jordan, custom reporting dashboards in Amman, website analytics, or ecommerce performance analysis?
Contact Smart Zone to discuss your data sources, reporting needs, and business objectives.
© Smartzone is Proudly Owned by Smartzone Smartzone
